Introduction
PCA for Classification showed that PCA removes unreliable dimensions by mixing the class covariance matrices in . But PCA weights each class by its number of training samples, which is the wrong way round for this job. Supervised PCA (SPCA) and asymmetric PCA (APCA) choose the class weights themselves, so the less reliable class gets the larger weight. This is solution 6, and the note ends with the conclusions of the whole topic.
Main idea
PCA mixes $\mathbf{S}^t=\sum_j\frac{q_j}{q}\boldsymbol{\Sigma}_j+\mathbf{S}^b$. SPCA uses $\boldsymbol{\Sigma}_a=\sum_j a_j\boldsymbol{\Sigma}_j+\eta\mathbf{S}^b$ and APCA uses $\boldsymbol{\Sigma}_a=a\boldsymbol{\Sigma}_o+\beta\boldsymbol{\Sigma}_c+\eta\mathbf{S}^b$, then do PCA on $\boldsymbol{\Sigma}_a$. Both give the larger weight to the less reliable covariance matrix, so more of its unreliable small-variance dimensions are removed.
Overview
The only change from PCA is the weights in the mixture:
Then take the eigenvectors of the largest eigenvalues of the new matrix, exactly as in PCA.
Step 1: problem of PCA for classification
Questions to ask:
- is the unsupervised PCA, which minimizes the data reconstruction error, the best dimensionality reduction for classification?
- how can PCA become a supervised method for an even better classification?
- how can PCA handle unbalanced data and asymmetric classes?
What goes wrong:
- the weight of class in is , so a class with more training samples is weighted more heavily
- a heavier class has more say in which directions get small eigenvalues of , so PCA removes more of the dimensions that are unreliable for the classes with many samples (Step 2 of PCA for Classification)
- but a class with few training samples has the less reliable covariance matrix, because fewer samples give worse estimates and more near-zero eigenvalues
So it is not the more reliable but the less reliable covariance matrix that should get the larger weight in the mixture, so that more dimensions with the small variances of this class are removed.
Step 2: SPCA and APCA
Replace the weights with weights chosen for classification, then do PCA on the new matrix .
Supervised PCA (SPCA) for classes:
Asymmetric PCA (APCA) for two classes and :
What the symbols are:
- , or and , are the weights of the class covariance matrices, set larger for the less reliable classes
- a class with a larger weight has more say in , so its small-variance directions are more likely to become small eigenvalues of and be dropped
- this and are class weights, not the of the eigenspectrum model or the constant of solution 1
- how to choose , , and is not given here, apart from the value in the experiment below
- is the weight of the between-class scatter
- it uses the class labels to build and , so it is a supervised method
- APCA is the two-class case with unequal (asymmetric) weights, useful when one class is much harder or much smaller than the other
The same idea applied to LDA gives asymmetric discriminant analysis (ADA).
Step 3: results
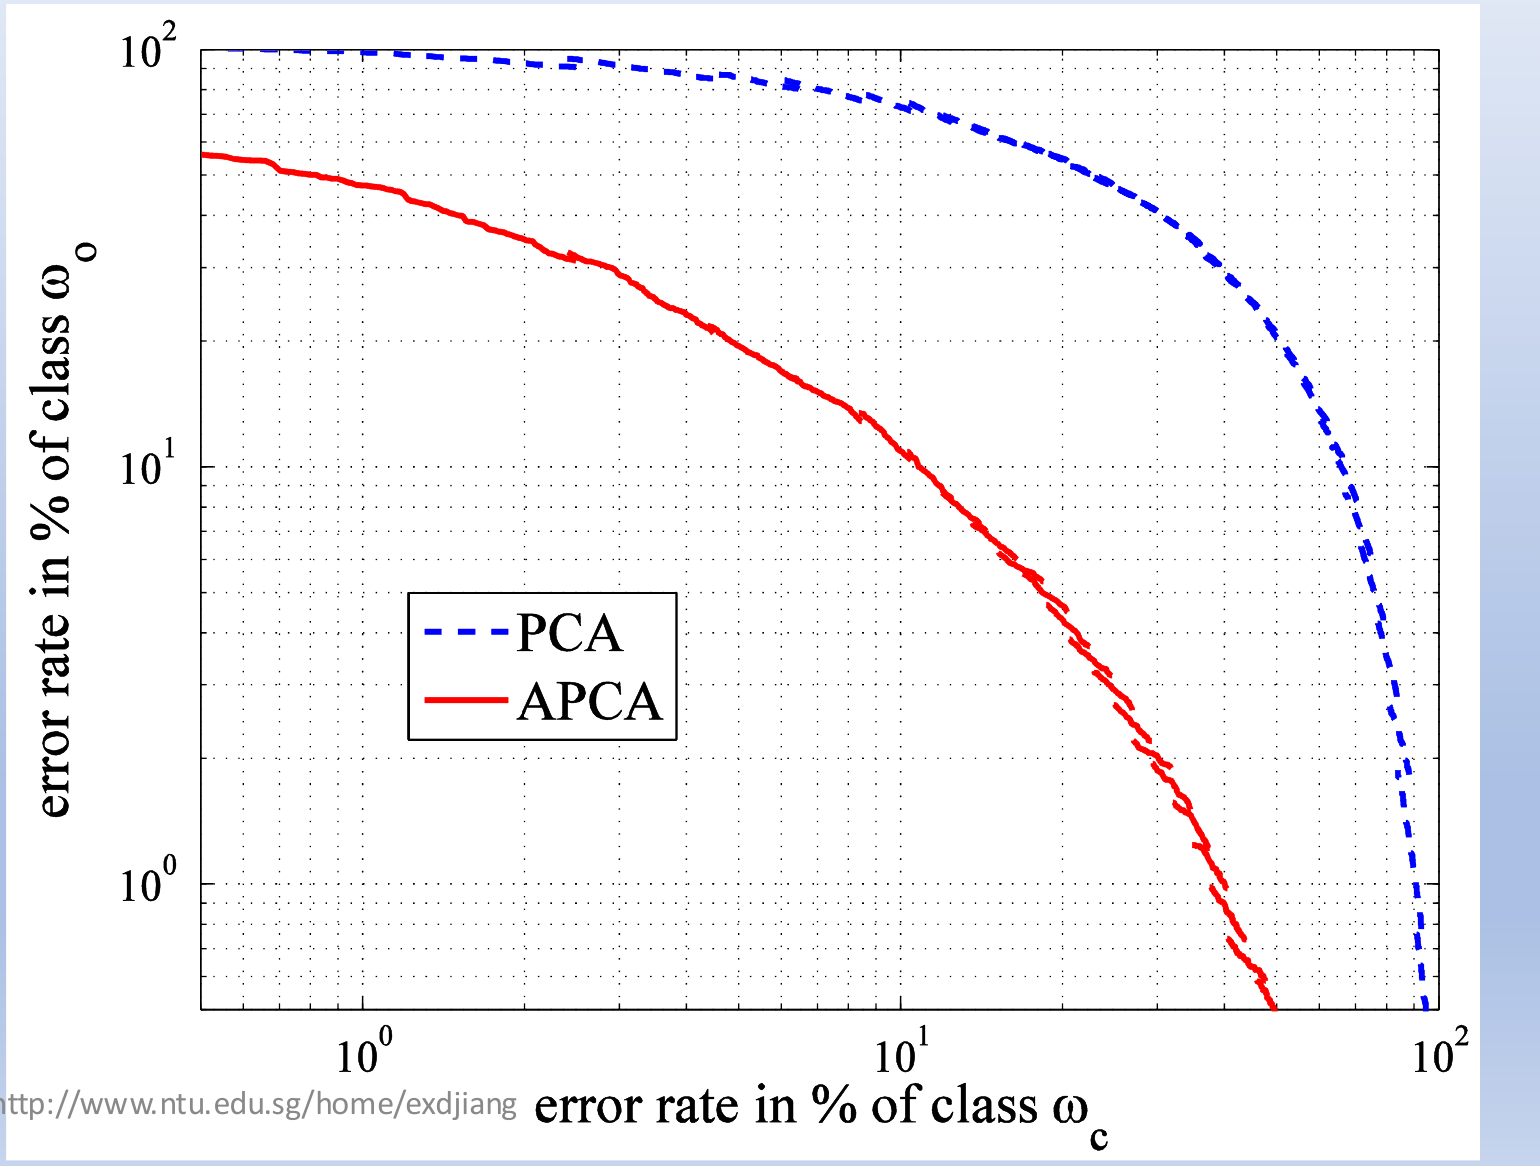
Two classes, (the object class) and (its counterpart class), of 400-dimensional data, with 2,000 and 500 training samples and 20,000 and 5,000 testing samples, reduced to with . Each curve shows the error rate of class against the error rate of class as the threshold changes. The APCA curve is far below the PCA curve, so APCA gives lower errors for both classes at the same time.
Class has 2,000 training samples and only 500, so PCA would weight them and . APCA sets the weight of to only , so the less reliable class gets the larger share.
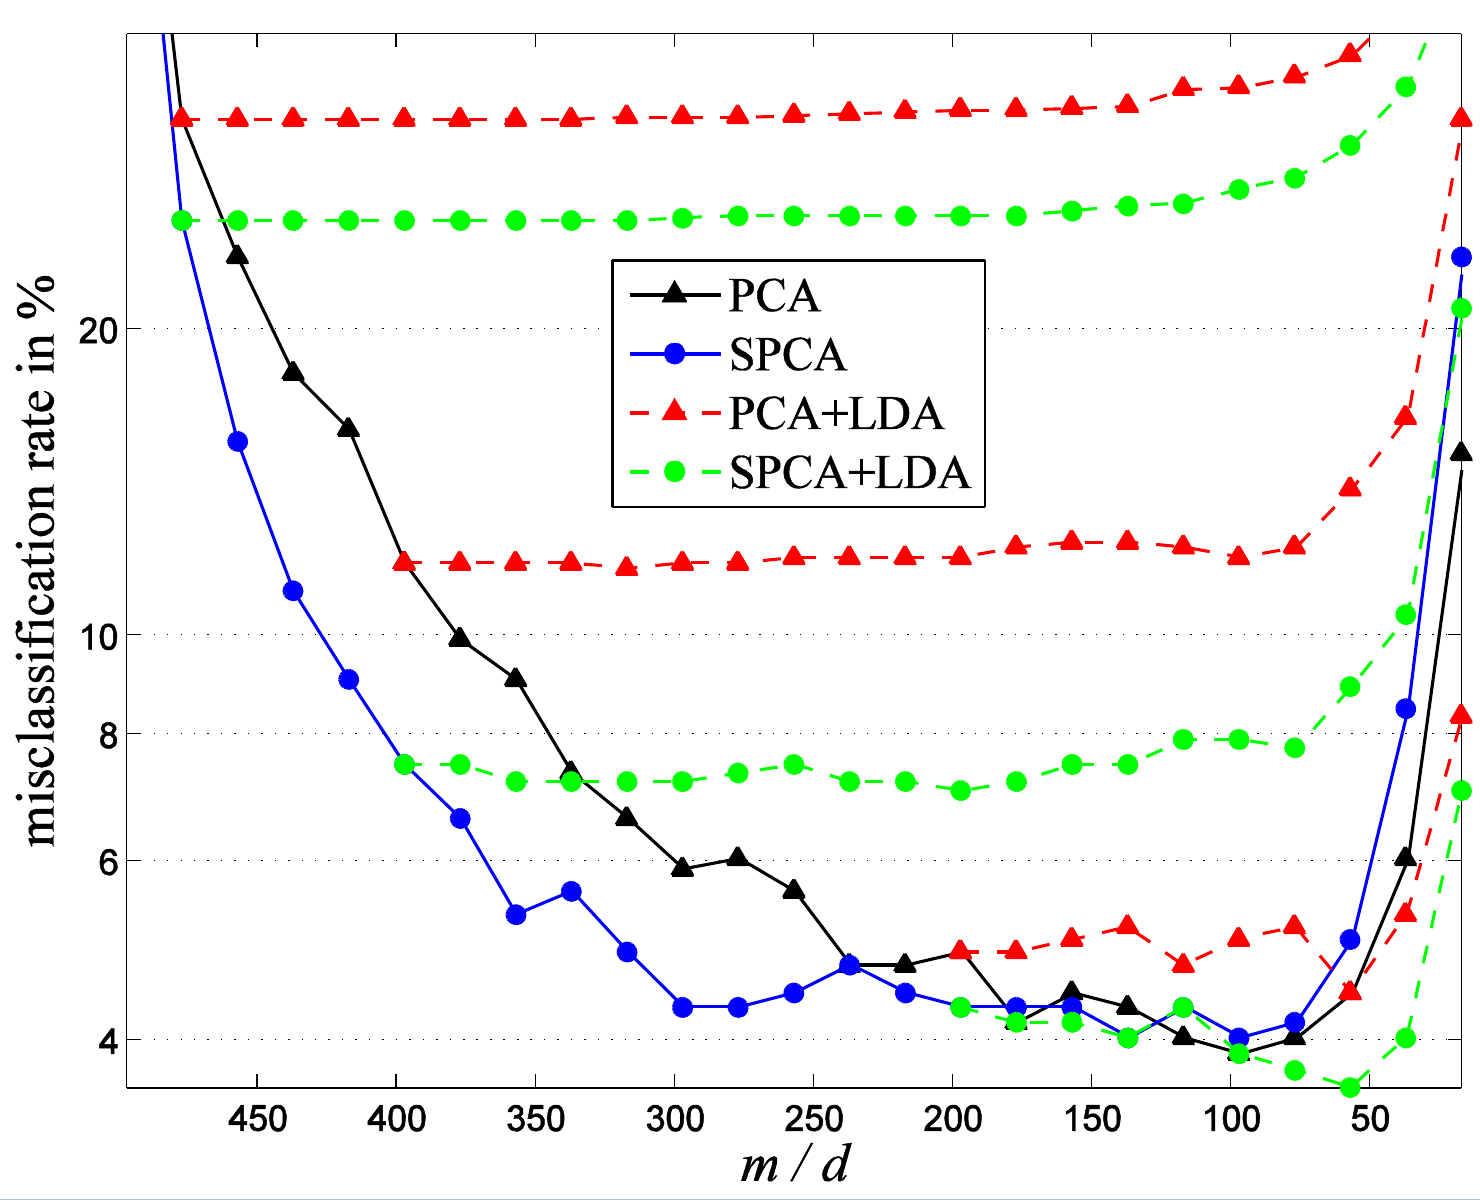
Face identification with images of size , 497 people for training and 697 other people for testing. The plot shows the misclassification rate against the reduced dimension.
Reading the figure:
- the solid curves reduce the data to dimensions by PCA (black) or SPCA (blue)
- the left end of each dashed curve is the dimension of the PCA or SPCA subspace, and the other points are the dimension that LDA then reduces it to
- the error first falls as the dimension decreases, which shows that removing unreliable dimensions raises the accuracy
- below about 60 dimensions the error rises sharply, because useful dimensions are now removed too
- SPCA is mostly lower than PCA, and SPCA followed by LDA reaches the lowest error
- LDA applied after only a small reduction (left end near ) gives a very high error, about 25% to 30%
- the same LDA applied after a strong reduction (near ) gives the lowest error, so LDA only helps once the unreliable dimensions are already removed, which is the "method R + LDA" curve of Objectives of Dimensionality Reduction
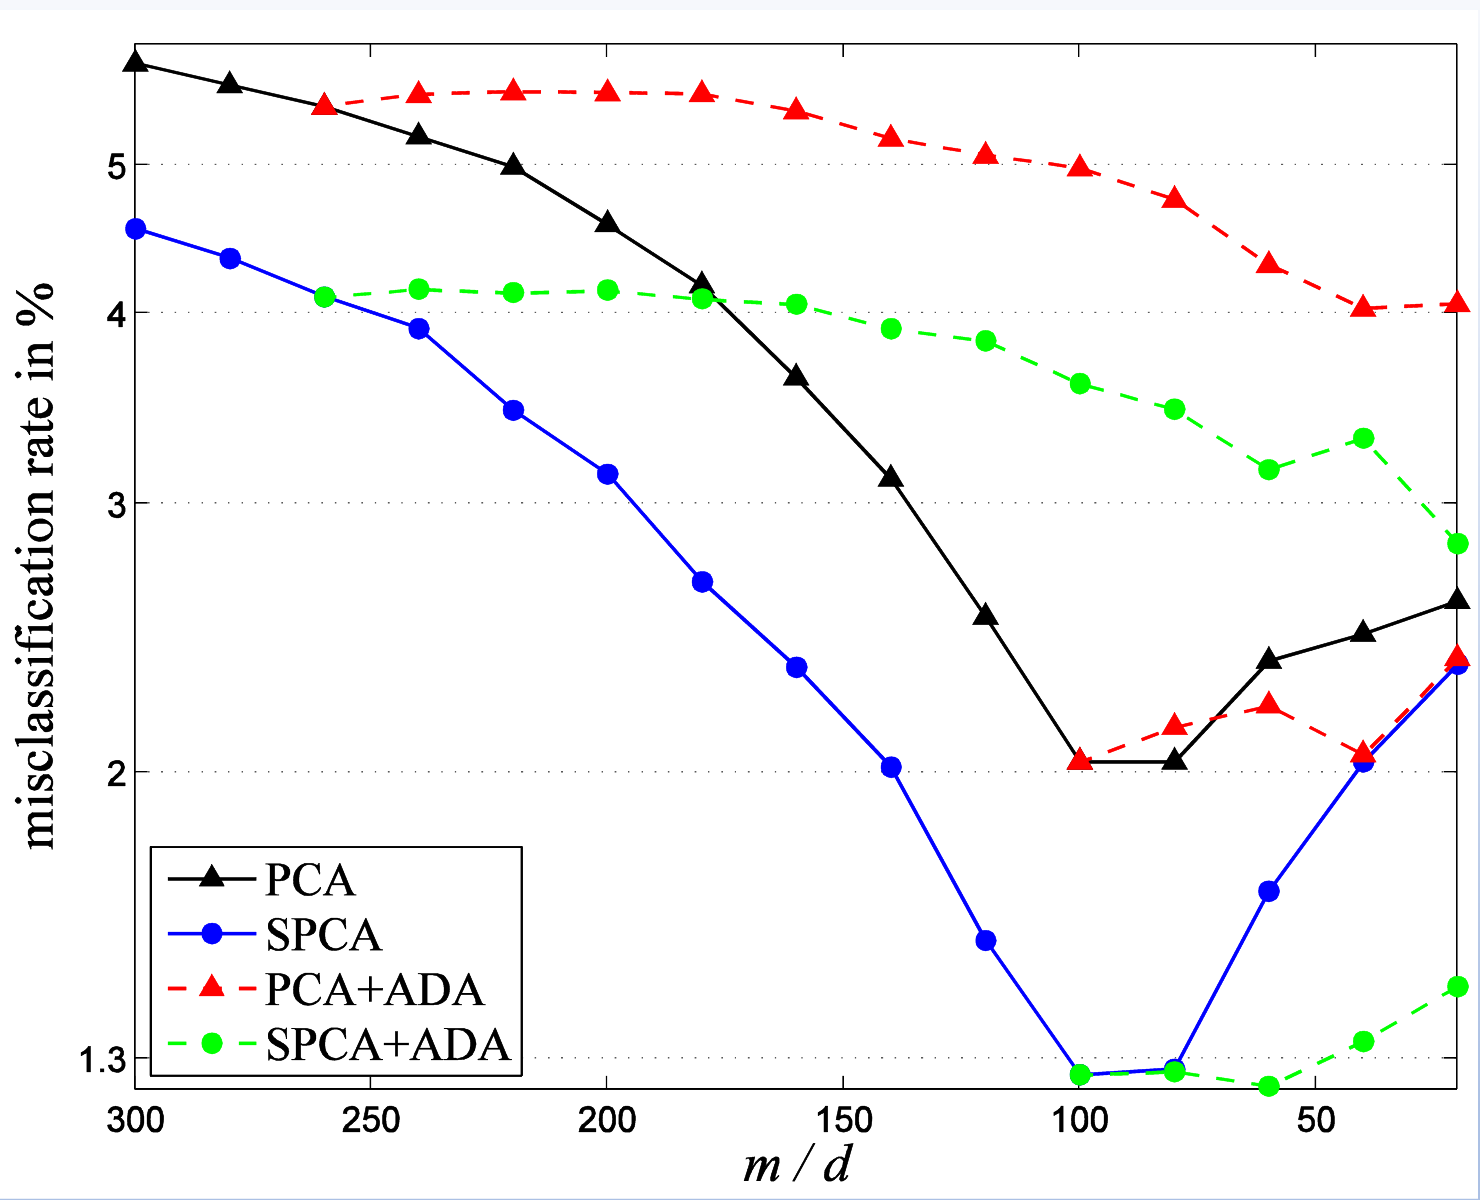
Face detection with images, 9,000 face images and 9,000 nonface images, 75% for training and 25% for testing. The dashed curves use ADA after PCA or SPCA.
Reading the figure:
- SPCA is lower than PCA at almost every dimension
- the lowest errors (about 1.3%) come from SPCA alone near and from SPCA followed by ADA
- PCA alone only reaches about 2%
Step 4: conclusions
What to remember from the whole topic:
- the final objective of a recognition system is to extract discriminative information about the whole data population, not about a specific training set
- a classifier is trained to capture the discriminative information on the training samples, so if some statistics estimated on the training data deviate from those of the population, the error rate on new data increases
- a discriminative criterion such as LDA cannot solve this, because in general it just repeats the classification process
- redundant information is not harmful for classification by itself
- so, to boost the accuracy, dimensionality reduction by machine learning should remove the dimensions that are unreliable (harmful, misleading) for classification, or regularize (correct) them
Why do we need this
It turns PCA from a method that only describes the data into one tuned for classification, by deciding which class's unreliable dimensions matter most.
Next step
Traditional Neural Network MLP starts the neural network part, where feature extraction and classification are learned together.
Visual 1: class weights decide which axis is dropped
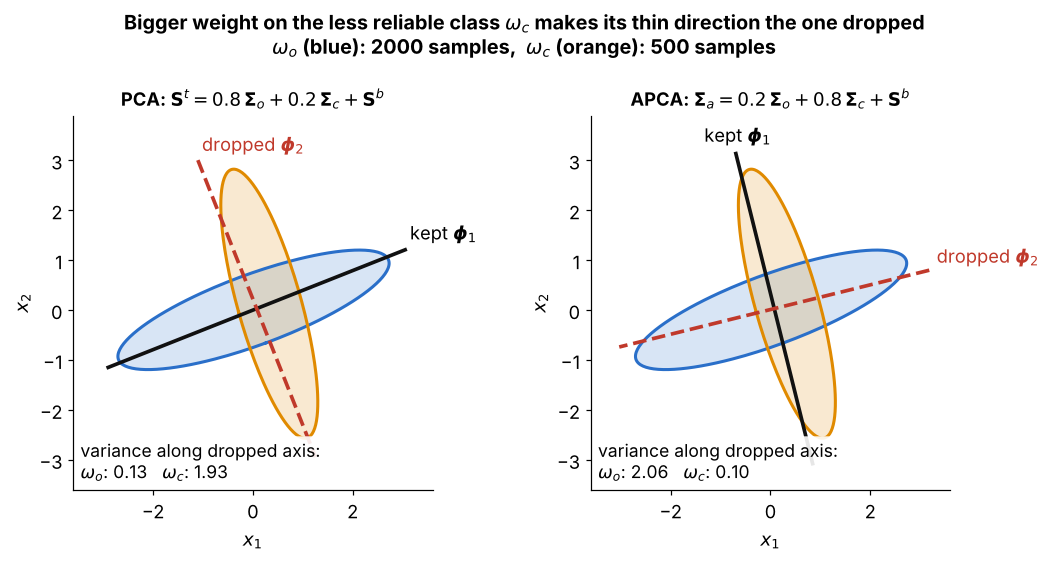
How to read it:
- each class is thin in one direction: (2,000 samples, blue) along one axis and (500 samples, orange) along another, and one of the two dimensions is kept
- left: PCA weights the classes by sample count, 0.8 and 0.2, so the dropped is the thin direction of the big class (variance 0.13 there), and the small class has little say, as Step 1 explains
- right: APCA with and (and ) makes the dropped axis the thin direction of , the class treated as less reliable (variance 0.10 there)
- so the class given the larger weight decides which small-variance direction is removed, which is solution 6