Introduction
Principal component analysis is an unsupervised method. It minimizes the reconstruction error and does not try to separate the classes. Yet PCA often raises the classification accuracy. The reason is that PCA removes the dimensions of the unreliable small eigenvalues of the class covariance matrices. This is solution 4, dimensionality reduction.
Main idea
Dimensionality reduction drops the terms with $k>m$ from $g_i(\mathbf{x})$, which is the same as replacing their eigenvalues with $\rho\to\infty$, a weight of zero. Since $\mathbf{S}^t=\sum_j\frac{q_j}{q}\boldsymbol{\Sigma}_j+\mathbf{S}^b$ and every part is never negative, a direction with a small eigenvalue of $\mathbf{S}^t$ also has a small weighted variance $\frac{q_j}{q}\boldsymbol{\phi}^T\boldsymbol{\Sigma}_j\boldsymbol{\phi}$ in every class, so it is an unreliable direction, mostly for the classes with many samples.
Overview
Solution 4 in one line, next to the regularized form:
Step 1: drop the small eigenvalues
Regularization keeps two parts and gives the unreliable dimensions a constant weight . Dimensionality reduction removes the second sum completely:
What this means:
- it is the limit of the regularized form, because then
- the dimensions no longer affect the decision at all
- the classifier works only in the kept dimensions
- is chosen by the user, and no rule for it is given here
One catch:
- in the index runs over the eigenvectors of each class matrix
- PCA uses the eigenvectors of , one set for all classes, so it does not drop the terms of each class exactly
- after PCA, each class covariance is estimated again inside the -dimensional subspace, and the classifier uses its eigenvalues there
- Step 2 shows that the directions PCA drops are also directions of small class variance, so the effect is close to dropping the small terms
Step 2: why PCA helps
A reminder of the scatter matrices (Scatter Matrices): with samples, in class , class covariance (built with ), class mean and overall mean :
- is the covariance of all samples together, ignoring the labels
- is the weighted average of the class covariances
- is the spread of the class means
PCA keeps the eigenvectors of the largest eigenvalues of the total scatter matrix, which mixes the class covariance matrices:
Project onto any unit vector . The variance along splits the same way:
Step by step:
- each is the variance of class along , and is the spread of the class means along it, so every term on the right is zero or positive
- a sum of terms that are never negative is small only if every term is small
- so when the eigenvalue of along is small, every weighted class variance is small too
- for a class with a large weight , this means its own variance along is small, which is an unreliable direction for that class
- a class with a small weight can still have a large variance there, so its unreliable directions are found less well, which is the weakness that Supervised and Asymmetric PCA fixes
This is the underlying principle behind PCA for classification: it removes the dimensions of the unreliable small eigenvalues of the class covariance matrices, though its criterion never mentions classes.
Why a small eigenvalue here is also an unreliable one: the directions of small eigenvalues are chosen from the same training samples, as the directions where these samples happen to be tightest, so the class variances measured along them come out too small for the same reason as in Discriminant Function in Eigenspace, Step 6.
Step 3: training eigenvalues against new data
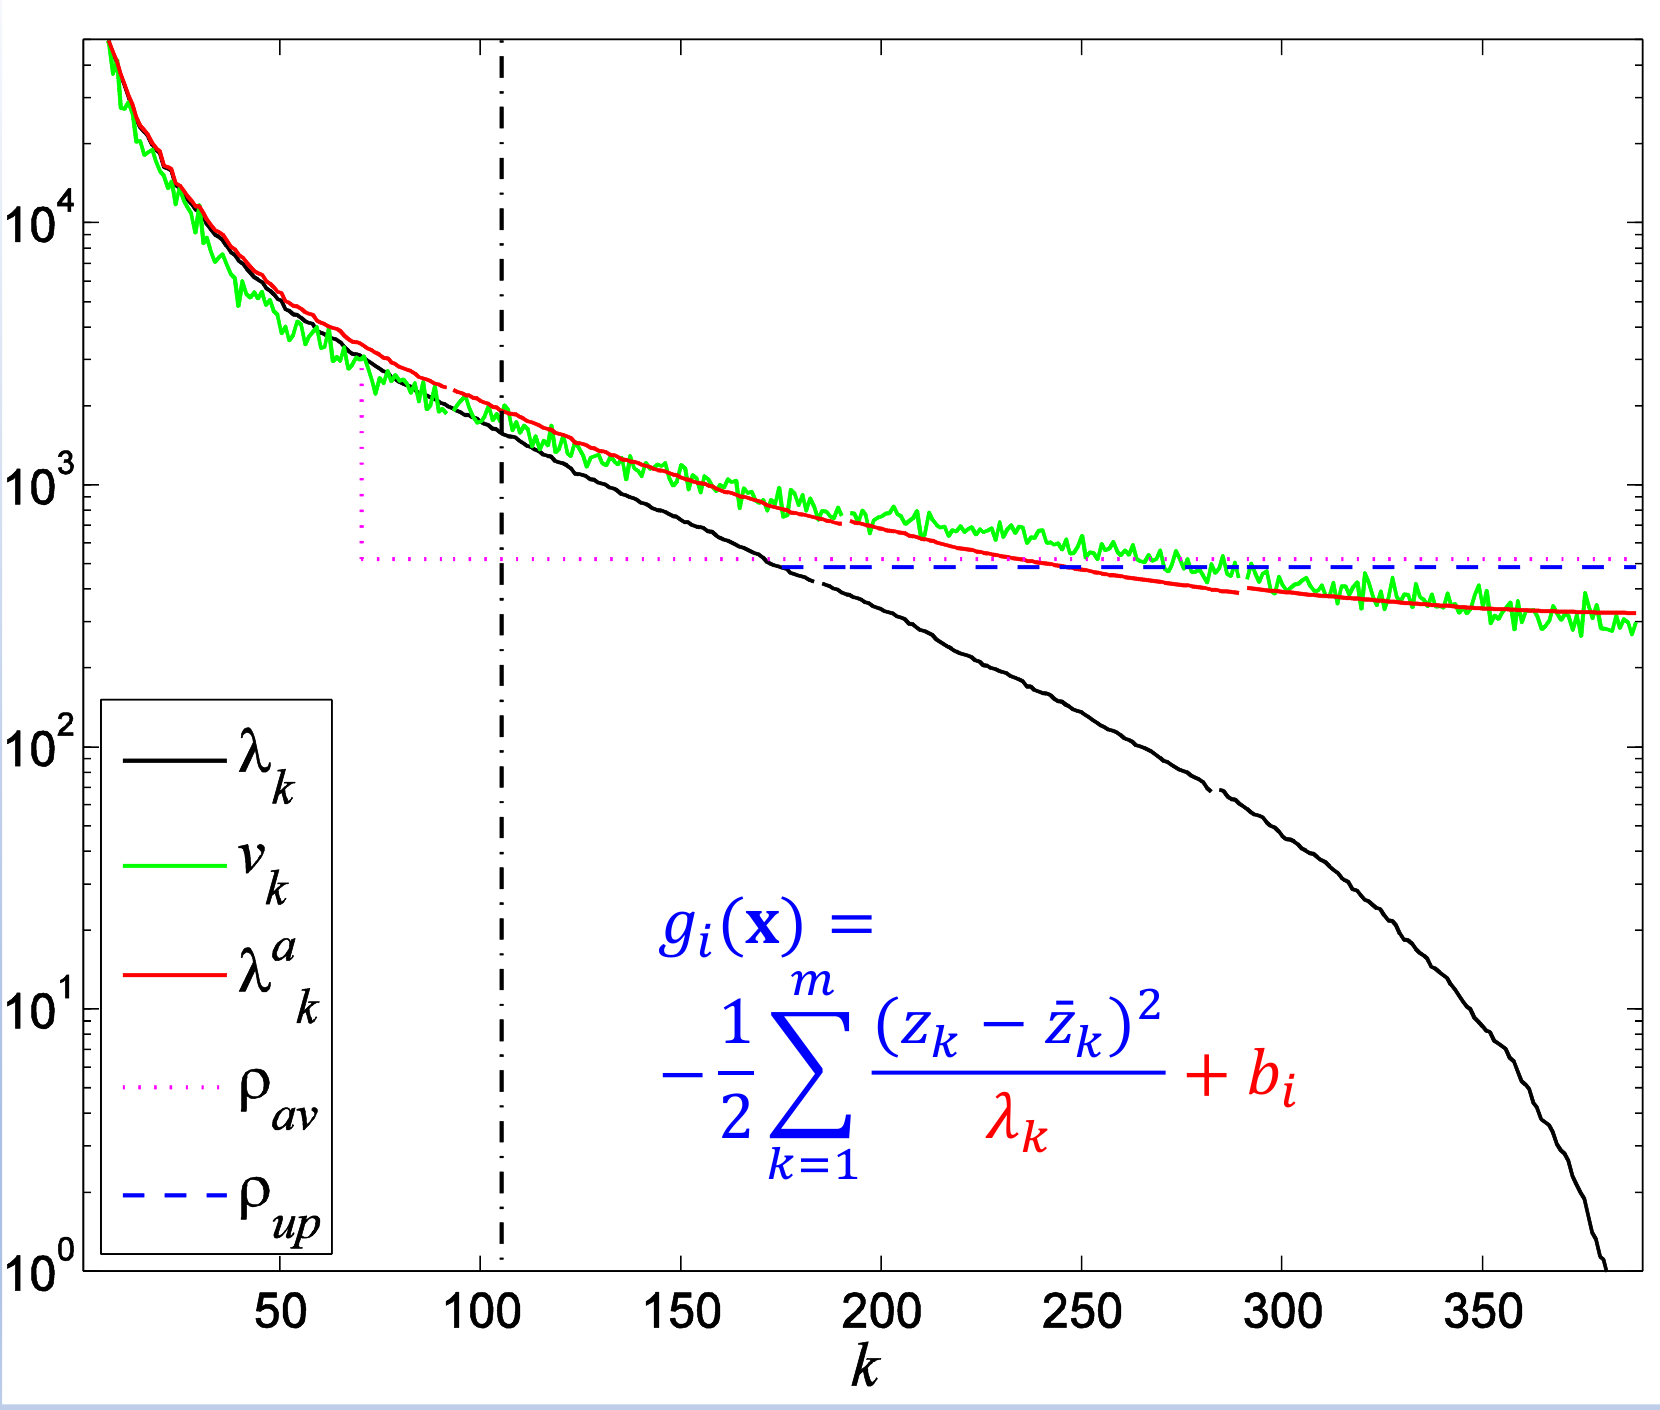
The black curve is the eigenspectrum learned from 400 face images. The green curve is the variance of 8,500 other face images projected onto the same eigenvectors , on a log scale.
Reading the figure:
- for small (up to about 100), and are close, so these dimensions are reliable
- for large , falls far below , by more than a factor of 100 at the end, so these dimensions are unreliable
- the red curve is a regularized eigenspectrum (the figure does not say which method), and it follows closely all the way
- the flat lines (dotted) and (dashed) are the constants of solutions 2 and 3, each drawn from its own , and the line starts exactly on the black curve, because
- with their own choices of , the two flat lines end up at about the same height, close to in the tail
- the vertical dash-dot line marks the kept dimension for the dimensionality reduction, and the shown keeps only the terms up to
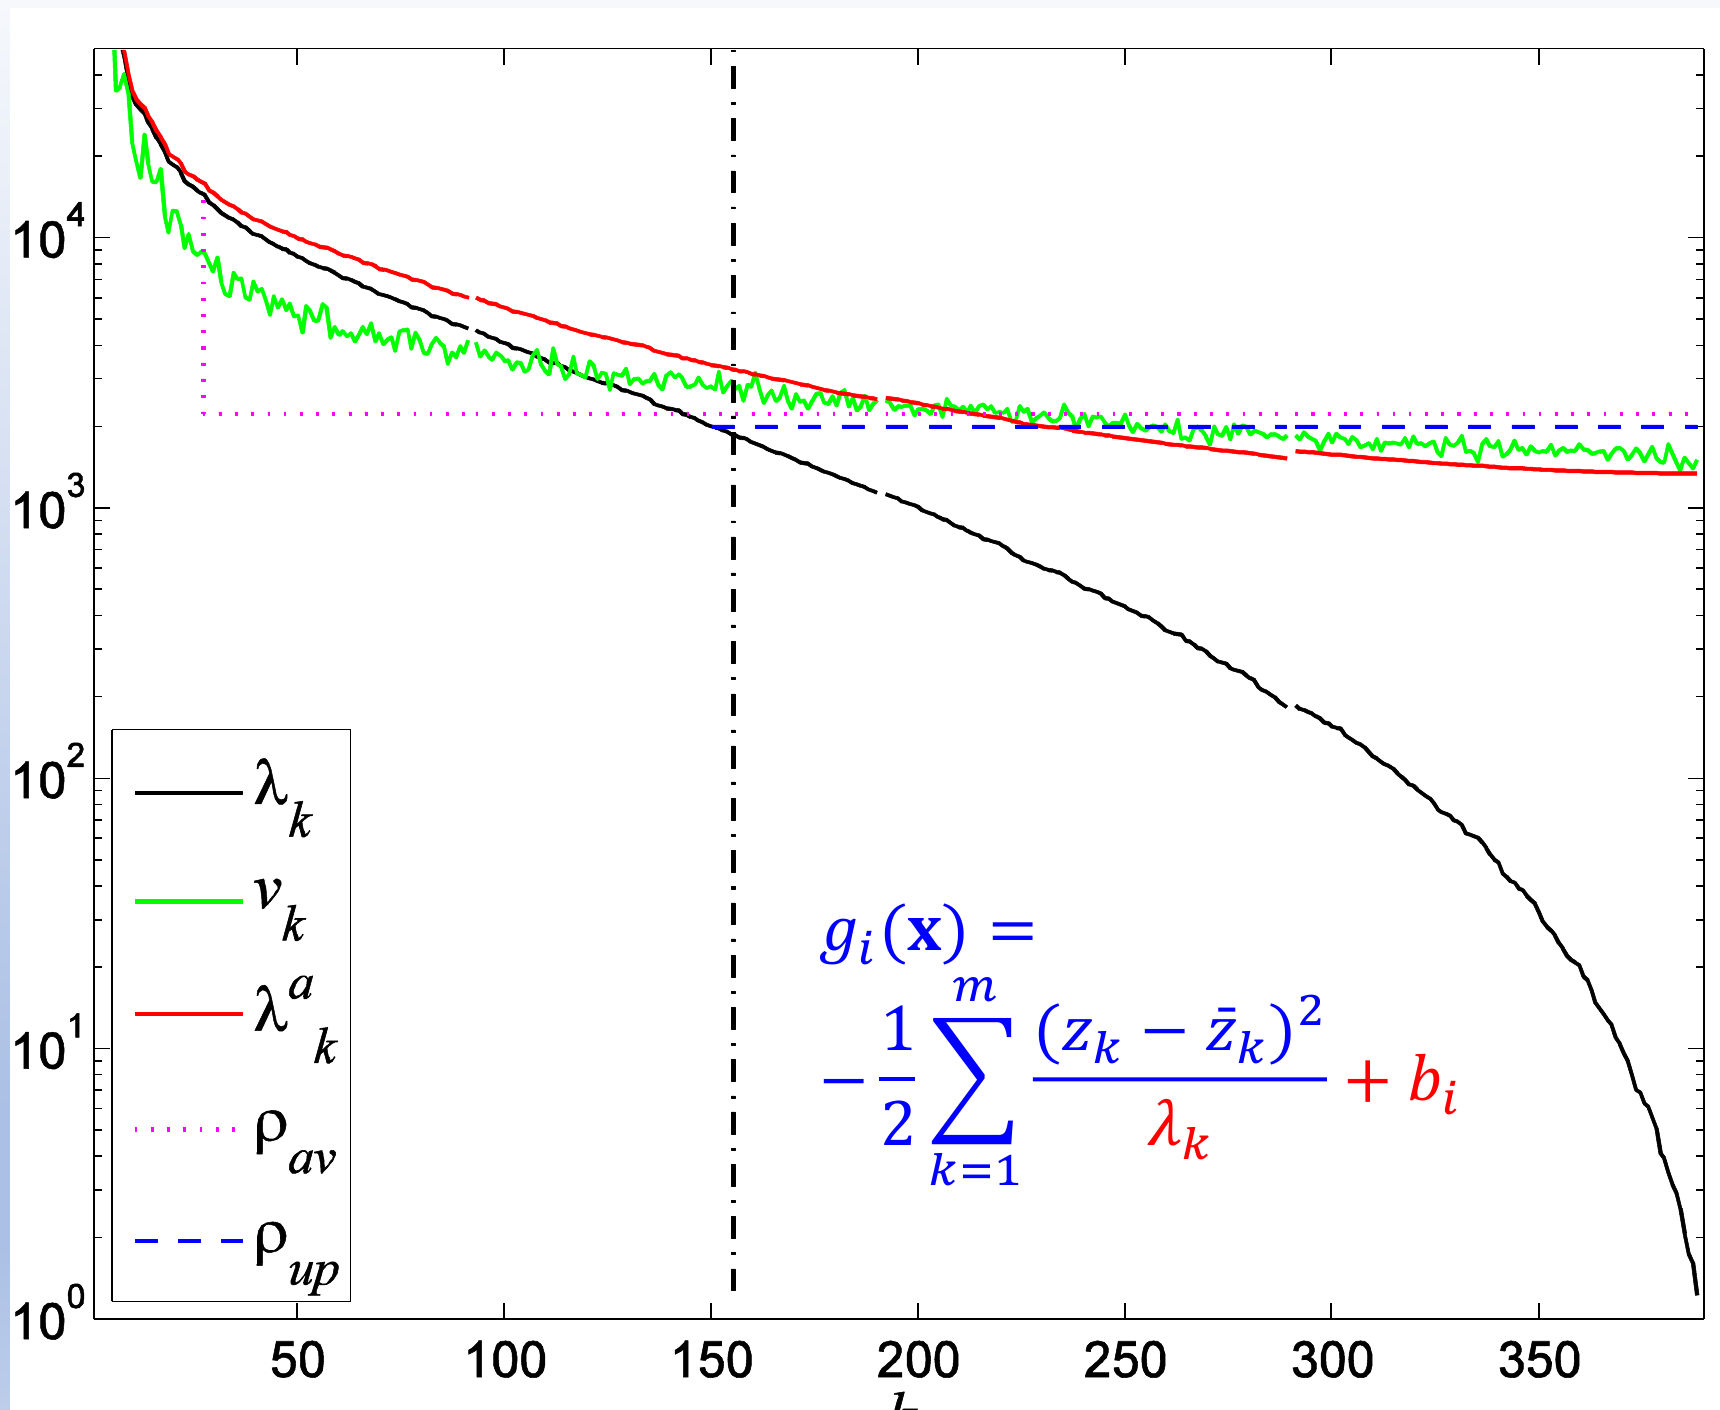
The same plot for 400 nonface images and 8,500 other nonface images:
- for up to about 150, the training is a little above , so these eigenvalues are too large, though only mildly
- beyond that, falls far below , as for faces
- the line starts near and the line starts on the black curve near the dash-dot , both close to in the tail
Step 4: all fixes in one picture
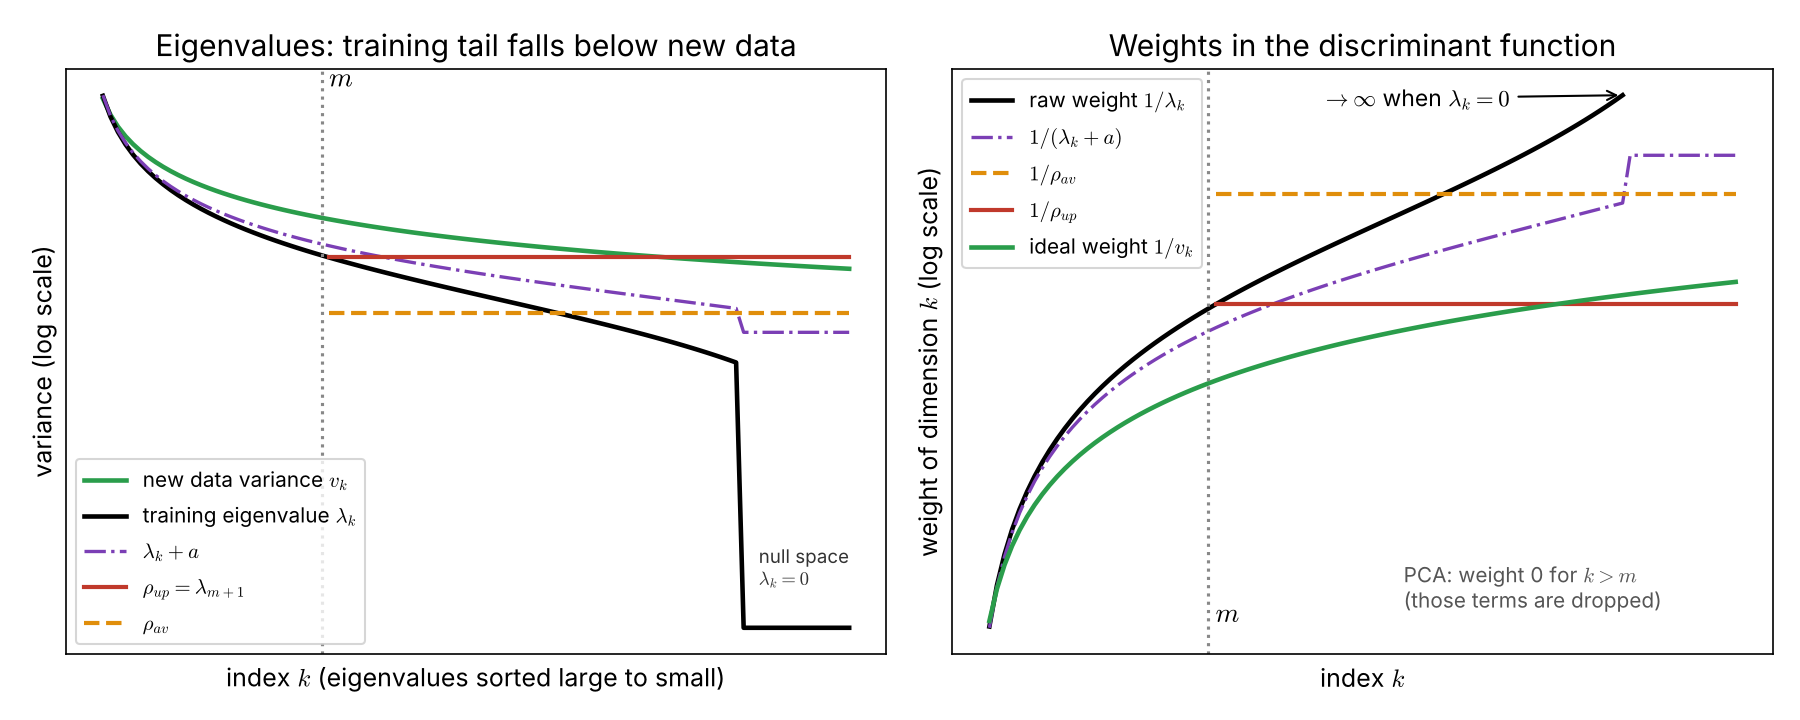
Reading the figure (a sketch, no real data):
- left: the training eigenvalues fall below the variances of new data in the tail, and drop to zero in the null space
- right: each fix changes the weight of the tail dimensions
- the ideal weight is , the weight a dimension would get if its variance on new data were known
- the raw weight explodes, and is infinite in the null space, is capped, and are flat, and is the closest to the ideal
- PCA sets the weight of every to zero
Why do we need this
It explains why an unsupervised method that only minimizes the reconstruction error can still raise classification accuracy: it removes exactly the dimensions whose small training variances would mislead the classifier.
Next step
Eigenspectrum Model replaces the unreliable eigenvalues with a smooth model instead of one constant.
Visual 1: what a small eigenvalue of says about each class
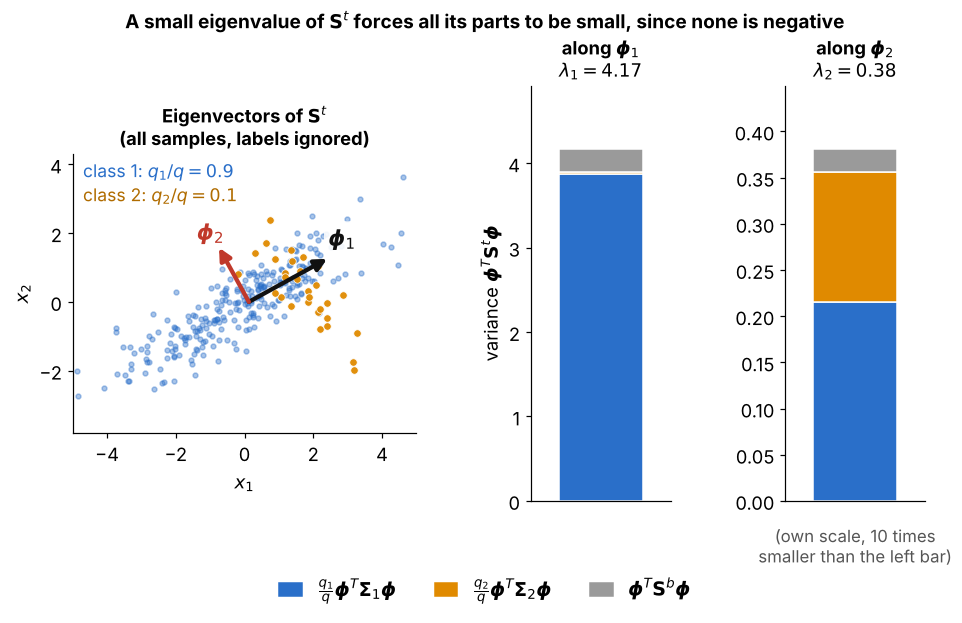
Step 2 on real numbers, how to read it:
- and are the eigenvectors of , computed from all 300 samples with the labels ignored
- each bar splits into , and , and the three parts add up exactly to the eigenvalue
- the right bar has its own scale: is about ten times smaller than , and since no part can be negative, every part of it is small too
- so along , the direction PCA drops, the weighted variance of every class is small