Source
Adapted from my own handwritten and hand-typed notes from Year 1 to Year 3 of my EEE degree
A Bode plot shows the magnitude in dB, , and the phase against . Because logs turn products into sums, the plot of a big transfer function is the sum of the plots of its single poles and zeros.
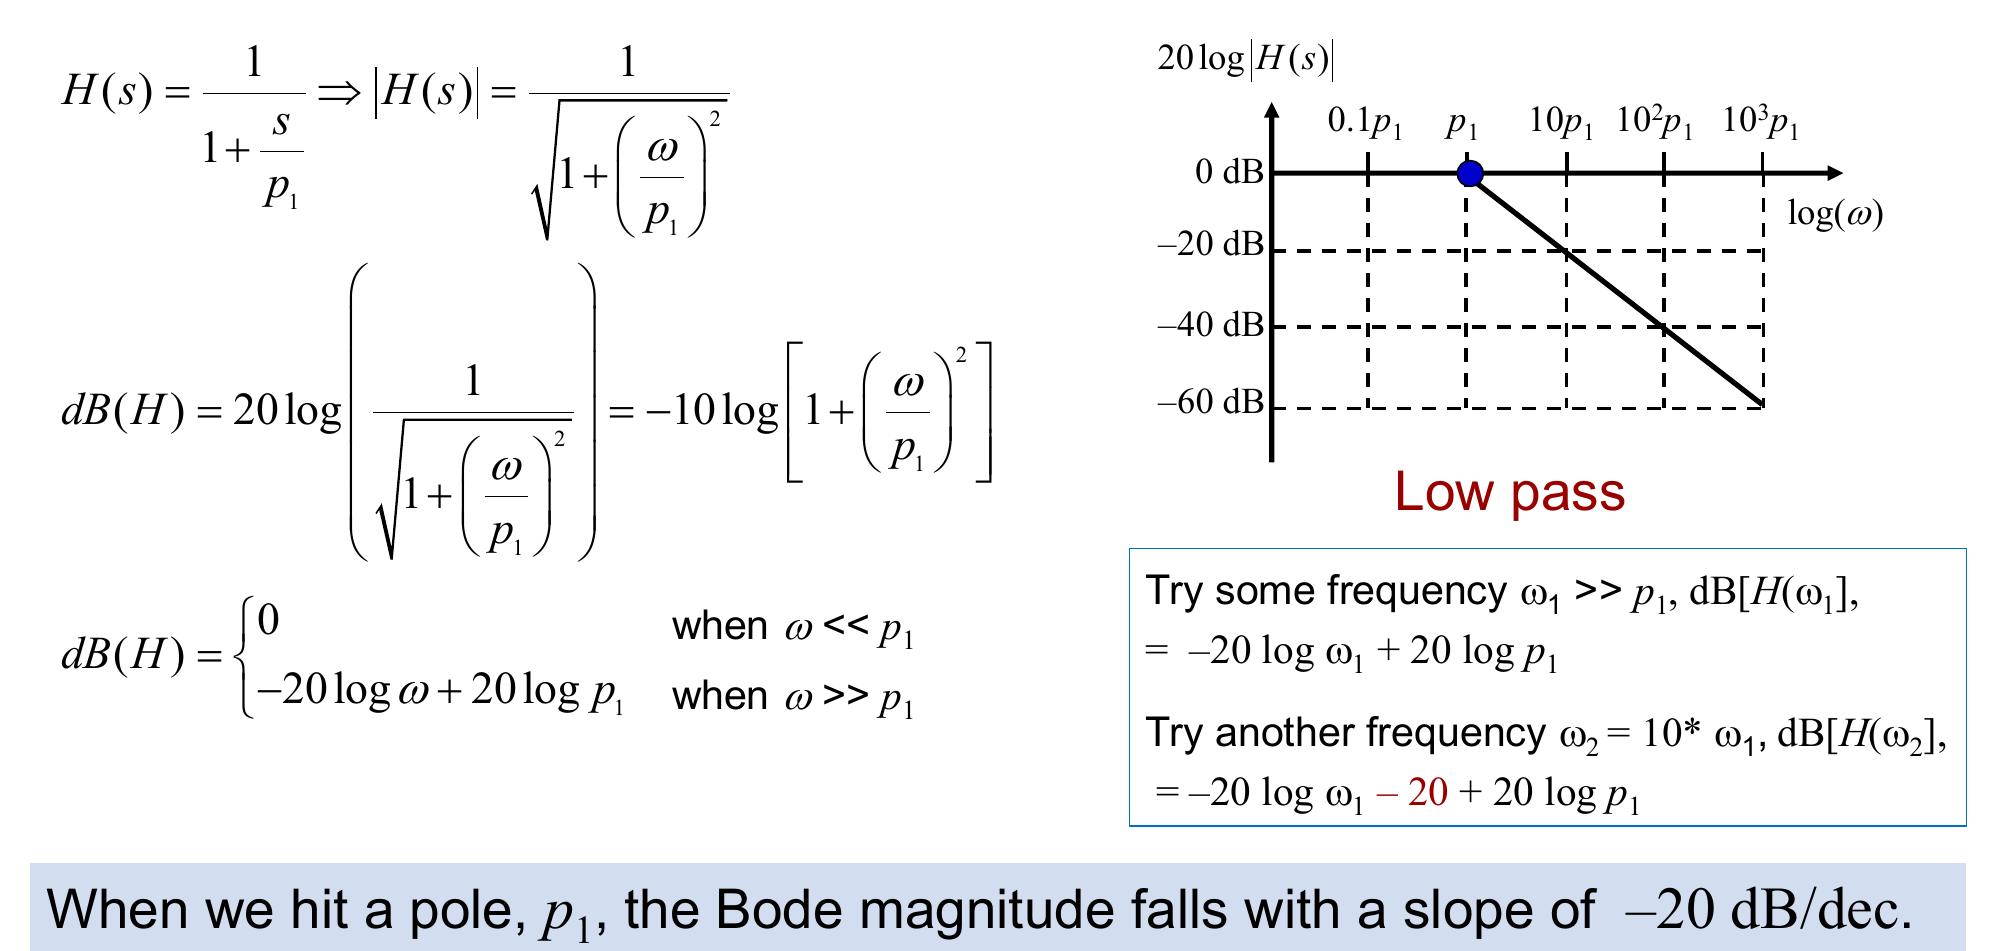
Single Pole
Magnitude:
- dB for
- for , a slope of dB/decade
- exactly dB at
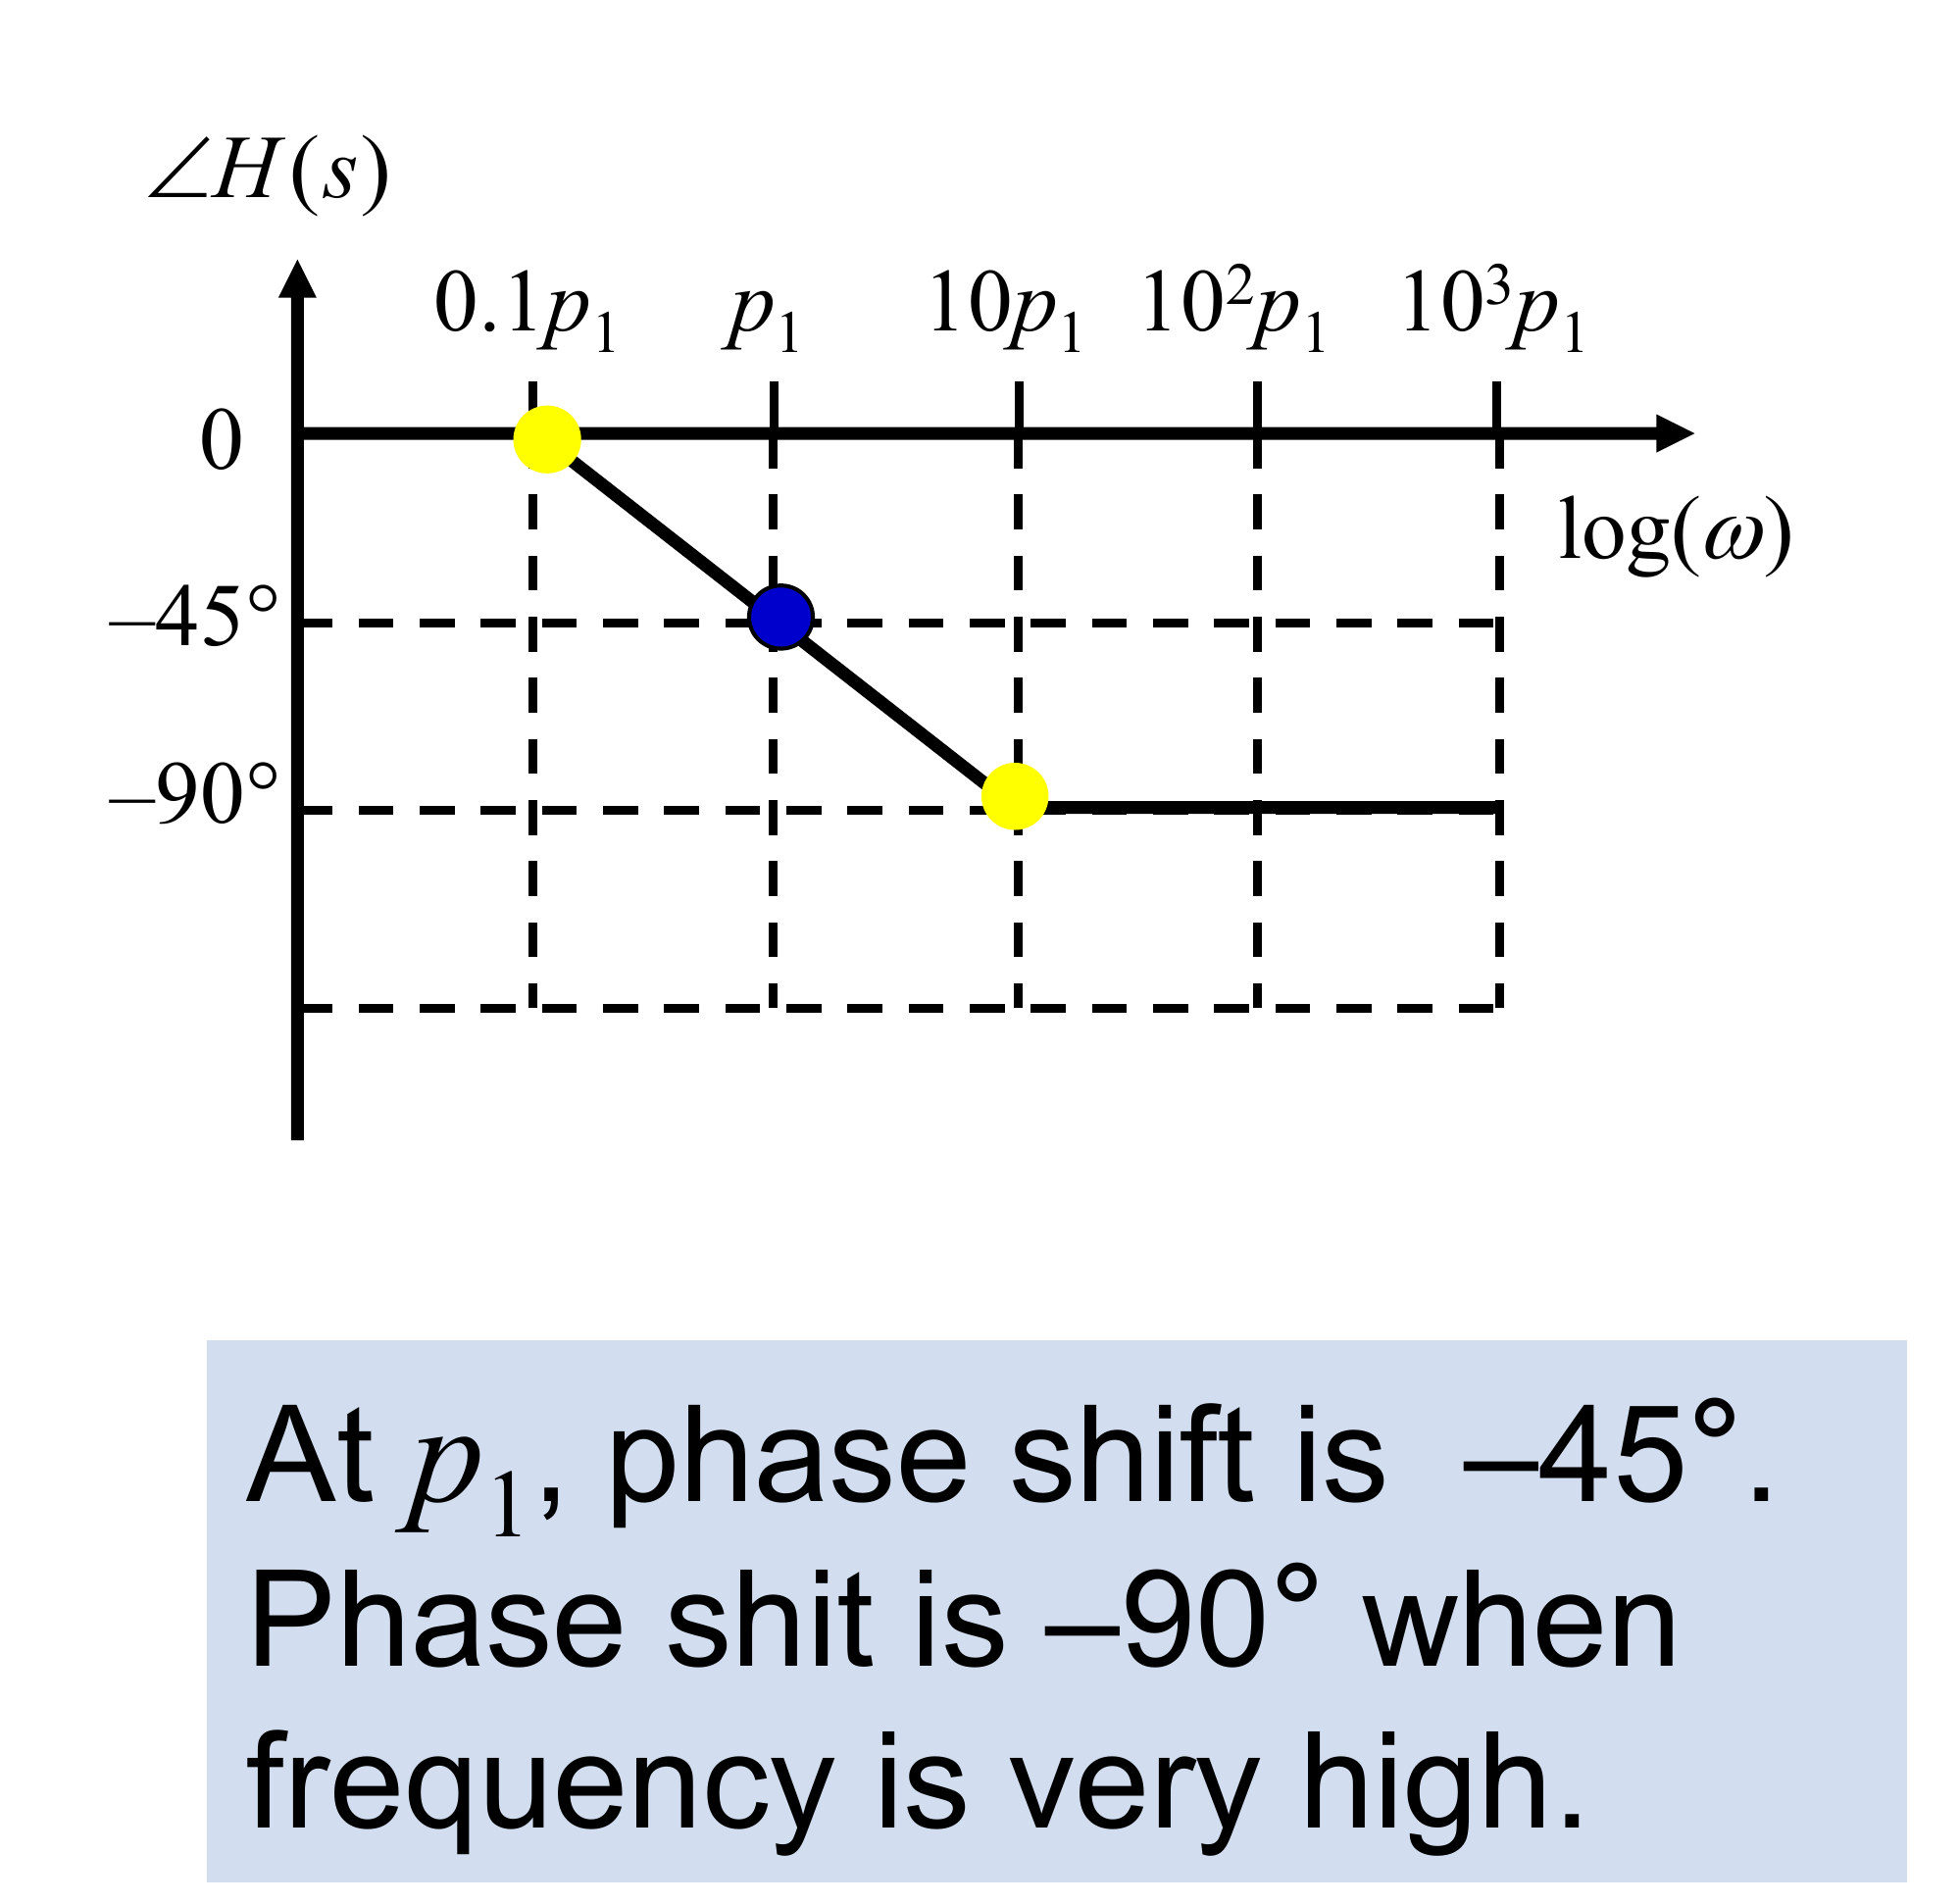
Phase :
- at
- at and at , tending to
- straight-line sketch: from at to at
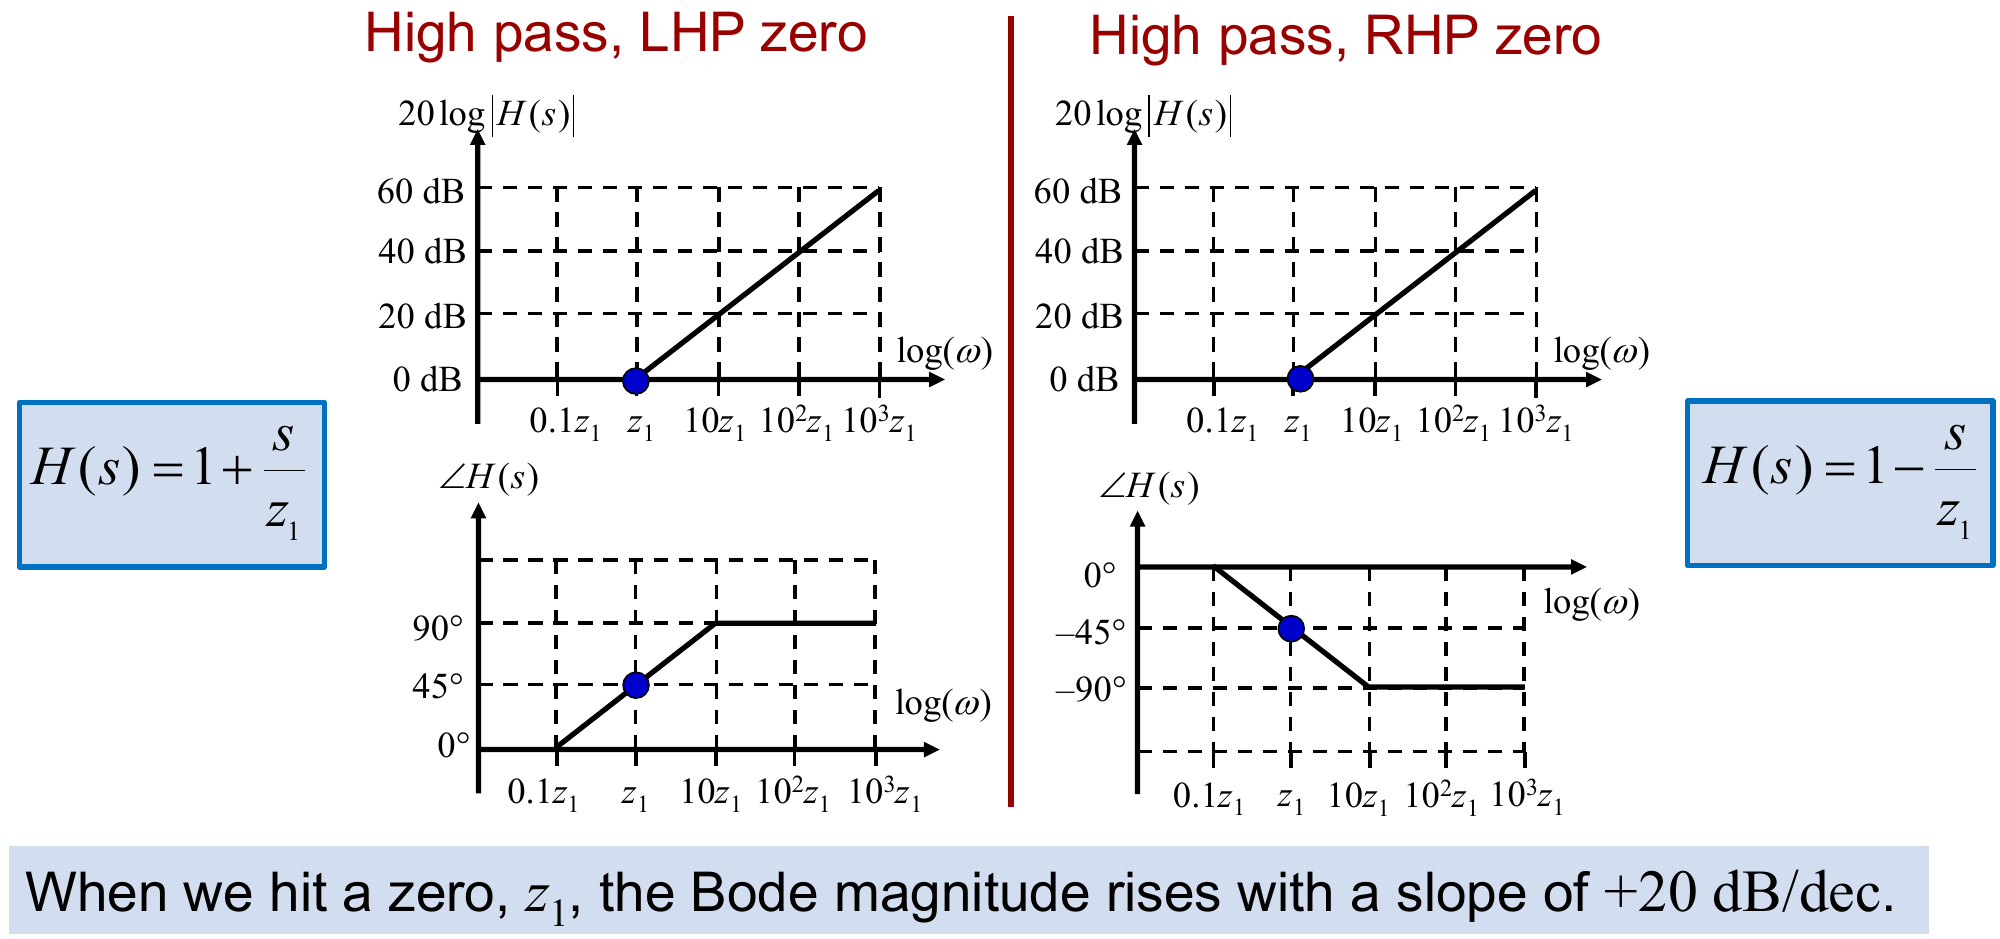
Single Zero
is the mirror image: dB/decade above , dB at , phase rising to . A RHP zero has the same magnitude but a phase going to . A zero at the origin () rises at dB/decade at every frequency, since never appears on a log axis.
Many Poles and Zeros
and the phases add the same way.
Hand Drawing Steps
Steps:
- replace by
- mark every pole and zero frequency on the axis
- the slope of each segment is dB/decade, counting only zeros and poles below that segment
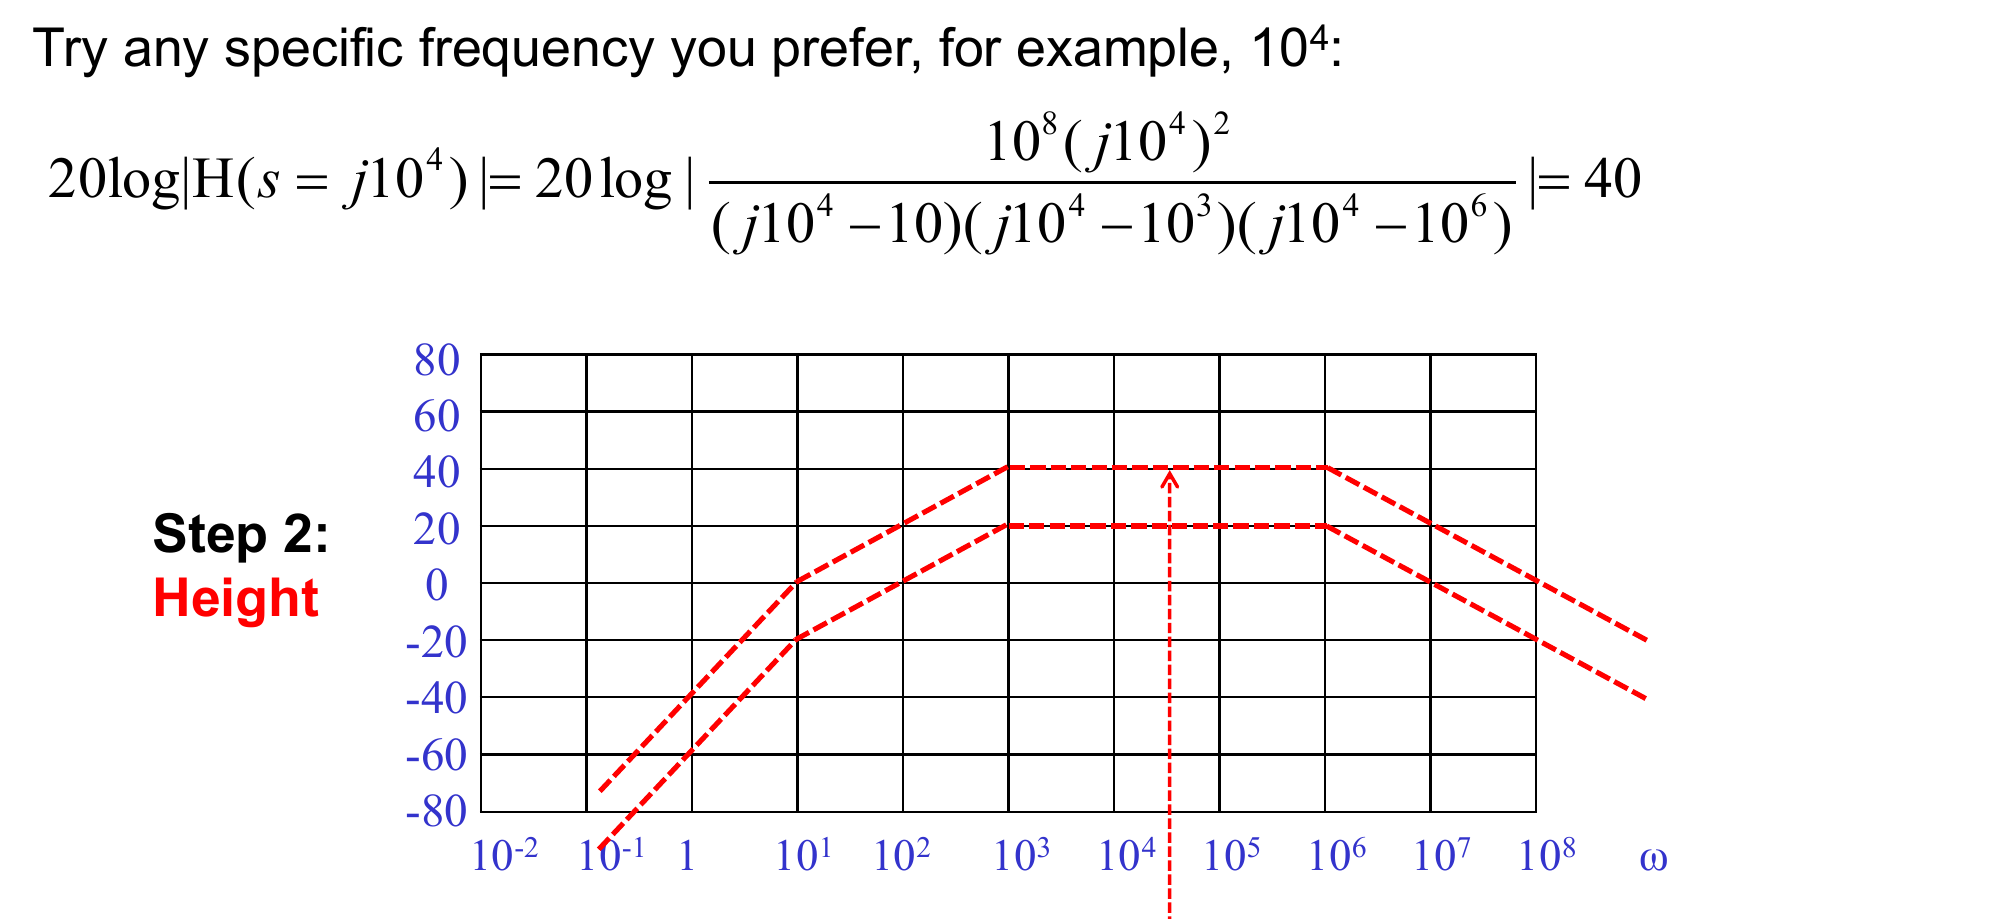
- pick one frequency at least a decade away from any corner, compute exactly in dB to fix the height
- draw the straight-line segments through that point
Worked Example
Shape: two zeros at the origin and poles at 10, , rad/s:
- below 10 rad/s: dB/decade
- 10 to rad/s: dB/decade
- to rad/s: flat
- above rad/s: dB/decade
Height at (mid-band): , which is 40 dB.
The two simplest one-pole circuits are the RC Low-Pass and High-Pass Filters.