The Receiver Operating Characteristic (ROC) curve is a graphical representation of a model's performance. The Area Under Curve of the ROC curve (AUC-ROC) measures how well scores rank positive examples above negative examples. It accepts positive-class probabilities or continuous decision scores.
Threshold
For these models, classification is done by choosing a decision boundary, which is a threshold value. For example, model outputs with a value can be labelled as class 1, and as class 0.
- different choices of decision boundary give a different True Positive Rate and False Positive Rate
- a low threshold labels more cases positive, which raises both rates
- a high threshold labels fewer cases positive, which lowers both rates
Curve
The ROC curve is created by plotting the True Positive Rate against the False Positive Rate as the model decision boundary is varied.
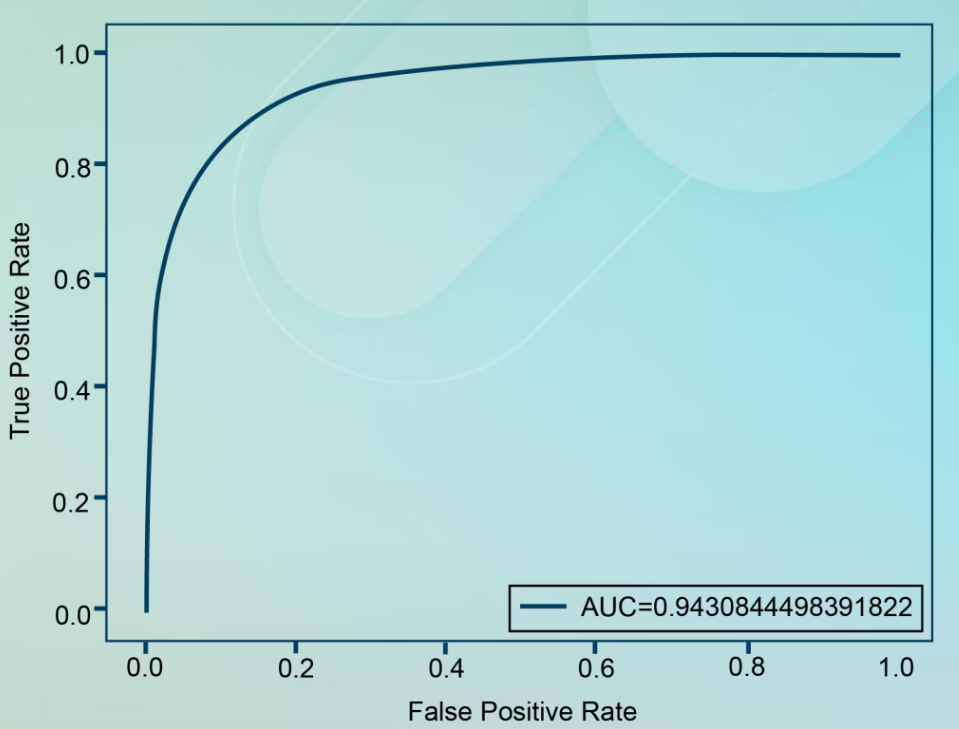
- the curve reflects the trade-off between a model's ability to:
- correctly identify positive instances
- its tendency to incorrectly classify negative instances as positive
- every point on the curve is 1 threshold, so the curve summarises every threshold at once
- a curve bending toward the top left corner is a model that gains true positives without collecting false positives
Scoring
The AUC-ROC is a scalar value that represents the area under the ROC curve, and values range from 0 to 1.
| AUC-ROC | Meaning |
|---|---|
| 0.5 | performs no better than random chance |
| greater than 0.5 | a better than random classifier |
| 1 | a perfect classifier, with perfect discrimination between the classes |
Choosing the score
predict_proba supplies probabilities. decision_function supplies decision scores for models that support it. Both can provide useful binary ROC rankings. predict supplies final class labels and discards most of the threshold information.
Probability columns follow model.classes_. Check that order before selecting the positive class. For a positive class other than the larger class label, explicitly encode the target as positive versus other. scikit-learn ROC-AUC reference.
The plotted rates come from a Confusion Matrix at each threshold.
Code
Plot a fitted classifier's scores
This block assumes a fitted log_regression model, transformed test reviews, and binary test labels. Import from sklearn import metrics and import matplotlib.pyplot as plt before using it.
# define metrics
y_pred_proba = log_regression.predict_proba(test_review_tfidf)[::,1]
fpr, tpr, _ = metrics.roc_curve(test_sent, y_pred_proba)
auc = metrics.roc_auc_score(test_sent, y_pred_proba)

# create ROC curve
plt.plot(fpr, tpr, label="AUC=" + str(auc))
plt.ylabel('True Positive Rate')
plt.xlabel('False Positive Rate')
plt.legend(loc=4)
plt.show()predict_probareturns probabilities rather than labels, and[: :,1]keeps the column for class 1- pass continuous probabilities or decision scores to
roc_curveandroc_auc_score, so the threshold can vary across the ranking roc_curvereturns the false positive rates, the true positive rates, and the thresholds, where the underscore discards the thresholds
Select the positive class explicitly
import numpy as np
from sklearn.linear_model import LogisticRegression
from sklearn.metrics import roc_auc_score

X = np.array([[-3.0], [-1.0], [1.0], [3.0]])
y = np.array([0, 0, 1, 1])
model = LogisticRegression().fit(X, y)
X_test = np.array([[-2.0], [2.0]])
y_test = np.array([0, 1])
positive_column = np.flatnonzero(model.classes_ == 1)[0]
probabilities = model.predict_proba(X_test)[:, positive_column]
scores = model.decision_function(X_test)
print(roc_auc_score(y_test, probabilities))  # 1.0
print(roc_auc_score(y_test, scores))         # 1.0
flatnonzero finds the probability column for class 1. The two score arrays have shape (2,). Both rank the positive example above the negative example, so both give AUC 1.0.