A Fourier Transform describes an image using spatial-frequency patterns instead of individual pixel locations.
In the spatial domain, tells us the intensity at one image position. In the frequency domain, tells us the amount and alignment of one sinusoidal pattern that extends across the complete image.
Core idea
One frequency coefficient does not represent one local object or image patch. It represents one full-image sinusoidal basis pattern. Adding all basis patterns reconstructs the original image.
From an Image to Its Frequency Representation
For a grayscale image of size :
The input and output have the same number of rows and columns:
| Representation | Shape | Value stored at each position |
|---|---|---|
| Spatial image | One real pixel intensity | |
| FFT result | One complex frequency coefficient | |
| Magnitude | Strength of each frequency | |
| Phase | Alignment of each frequency |
The FFT changes the meaning and data type of the array. It does not resize the array. An image produces frequency coefficients.
For an RGB image, the FFT can be applied separately to the red, green, and blue channels. It can also be applied to one luminance channel when the task concerns brightness structure.
Extra implementation detail
The array shape stays the same, but the memory usage can increase because a complex coefficient stores a real part and an imaginary part. For example, one
uint8pixel uses 1 byte, while onecomplex128coefficient uses 16 bytes. The exact data type depends on the software implementation.
What the FFT Output Looks Like
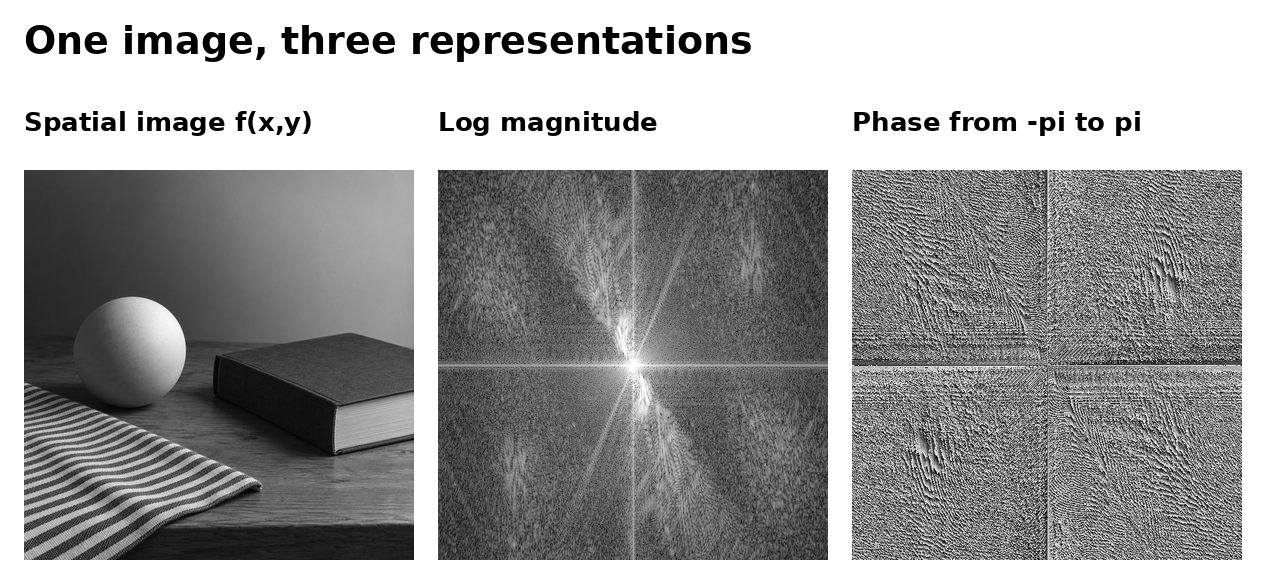
The raw FFT places the zero-frequency coefficient at an array corner. fftshift() rearranges the coefficients so that the zero-frequency coefficient appears at the centre. It does not calculate a new transform or change the information.
After fftshift():
- Centre: low frequencies and the average-brightness component
- Far from the centre: high frequencies and fine spatial changes
- Direction from the centre: direction in which image intensity varies
- Brightness in the magnitude display: strength of the coefficient at that frequency position
The exact centre is the DC coefficient:
With the common unnormalized forward FFT, the average intensity is:
The DC coefficient is usually much larger than the other coefficients. A direct magnitude display can therefore look almost black except at the centre. A log display compresses this range:
The log changes only the visualization. Filtering still uses the original complex coefficients.
Distance and Direction in the Centred Spectrum
For a centred spectrum, the distance from coefficient to the centre is:
Small means slow intensity variation. Large means rapid intensity variation.
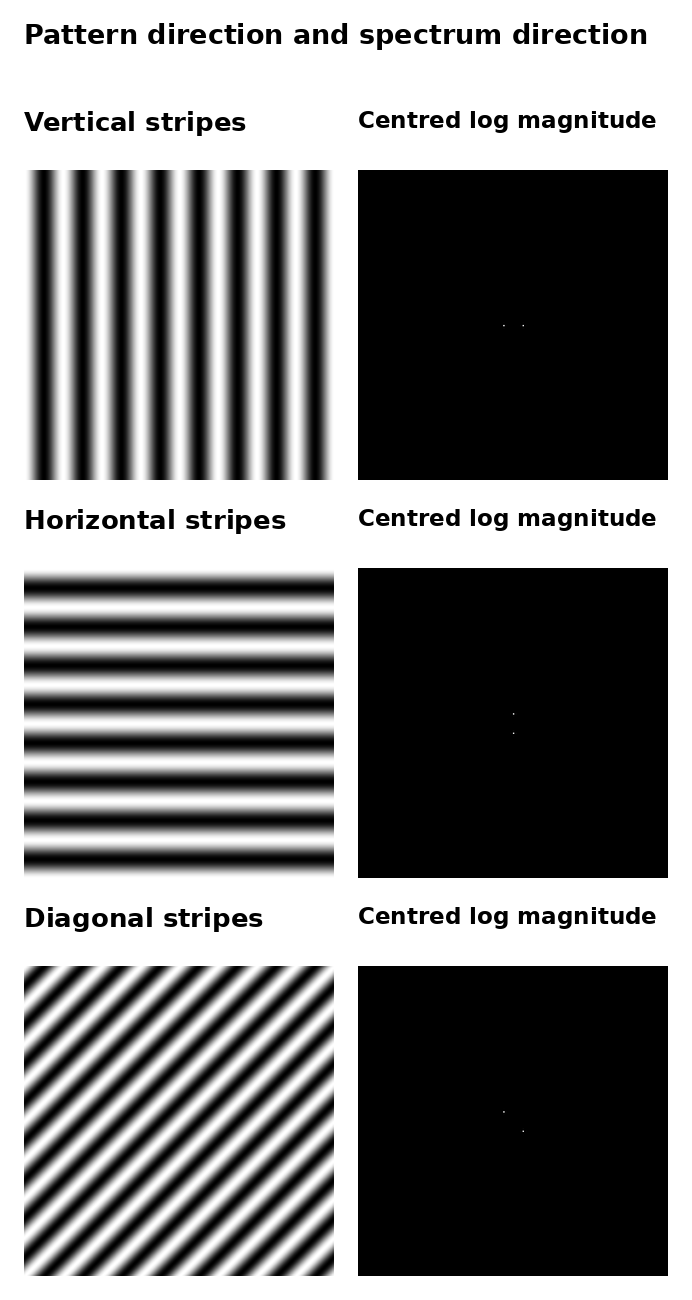
The spectrum direction gives the direction of intensity change:
- Vertical stripes change when moving left or right, so their peaks lie on the horizontal frequency axis
- Horizontal stripes change when moving up or down, so their peaks lie on the vertical frequency axis
- Diagonal stripes produce peaks along a diagonal frequency direction
The visible stripe direction is perpendicular to the direction of intensity variation. Real-valued images usually produce symmetric coefficient pairs on opposite sides of the centre.
Meaning of One Frequency Coefficient
One coefficient is a complex number:
It can also be written in polar form:
Its magnitude and phase are:
The position selects the frequency and direction of the basis pattern:
- controls variation across the horizontal image coordinate
- controls variation across the vertical image coordinate
The coefficient then controls two properties:
- Magnitude : how strongly that basis pattern contributes to the image
- Phase : where the peaks, troughs, and zero crossings of that pattern align
Conceptually, the real contribution of a matching frequency pair has this form:
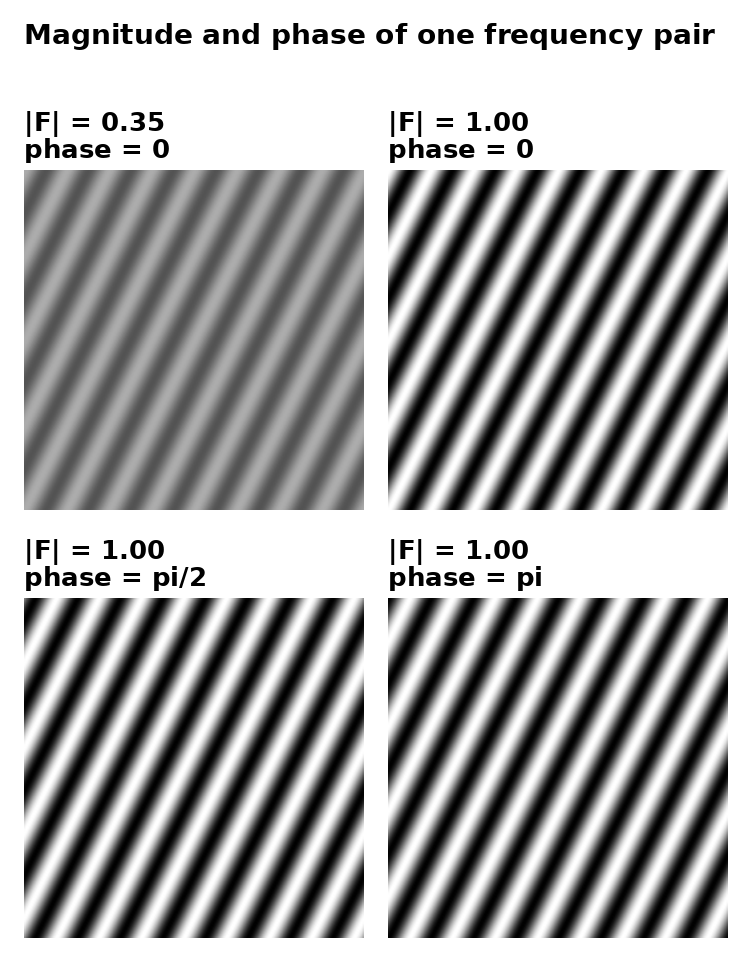
Increasing the magnitude increases the pattern contrast. Changing the phase shifts the same pattern across the image. Its frequency and direction remain unchanged.
Magnitude and Phase Across the Complete Image
The magnitude spectrum records the strength of every spatial frequency. The phase spectrum records the alignment of every spatial frequency.
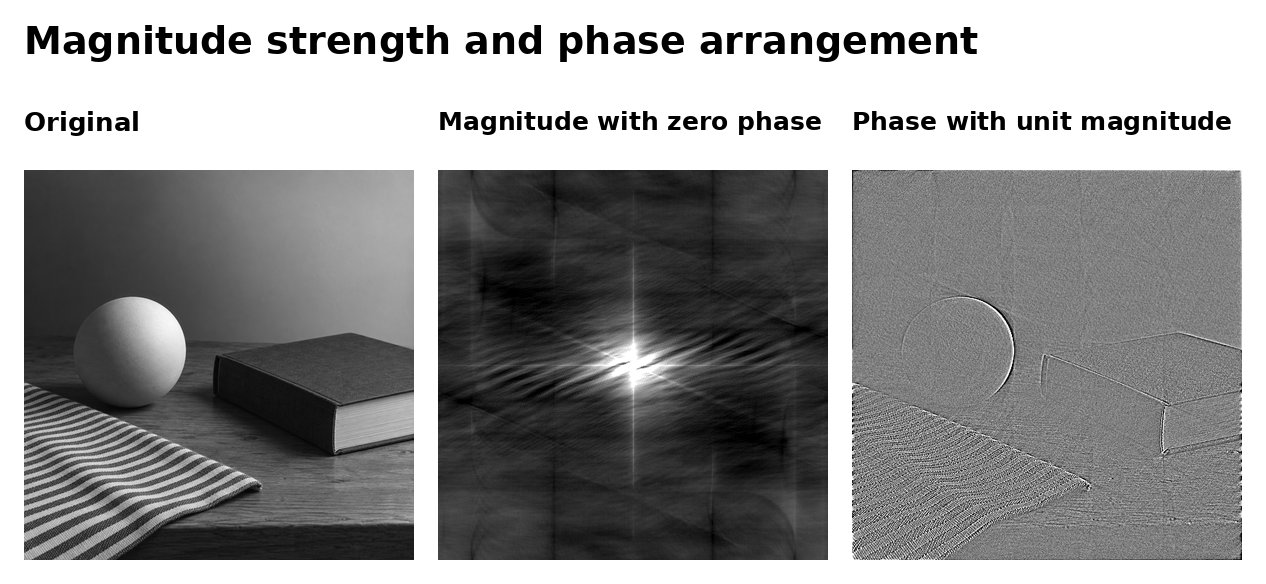
The magnitude-only reconstruction uses the original magnitudes with every phase set to zero. The frequency strengths remain, but their spatial arrangement changes.
The phase-only reconstruction keeps the original phases and gives every coefficient unit magnitude. Object positions and boundaries remain more recognizable because the relative alignment remains. Natural-image structure commonly depends strongly on phase, but both magnitude and phase are required for exact reconstruction.
Complete reconstruction
Magnitude alone cannot reconstruct the original image. Phase alone cannot reconstruct the original image. The inverse FFT needs the complete complex coefficients.
Why a Normal Image Has Frequency Content
Each individual Fourier basis pattern repeats. Their sum can form a localized and non-repeating-looking image.
Different image structures require different mixtures:
- Smooth illumination uses strong low-frequency components
- Large gradual shapes use mainly low and medium frequencies
- Sharp boundaries require a wide range of frequencies
- Fine textures use high frequencies
- Repeating patterns produce concentrated symmetric peaks
- One isolated pixel spreads energy across the complete frequency domain
The phases align the repeating basis patterns so that they reinforce at required image locations and cancel at other locations.
Keeping Different Parts of the Spectrum
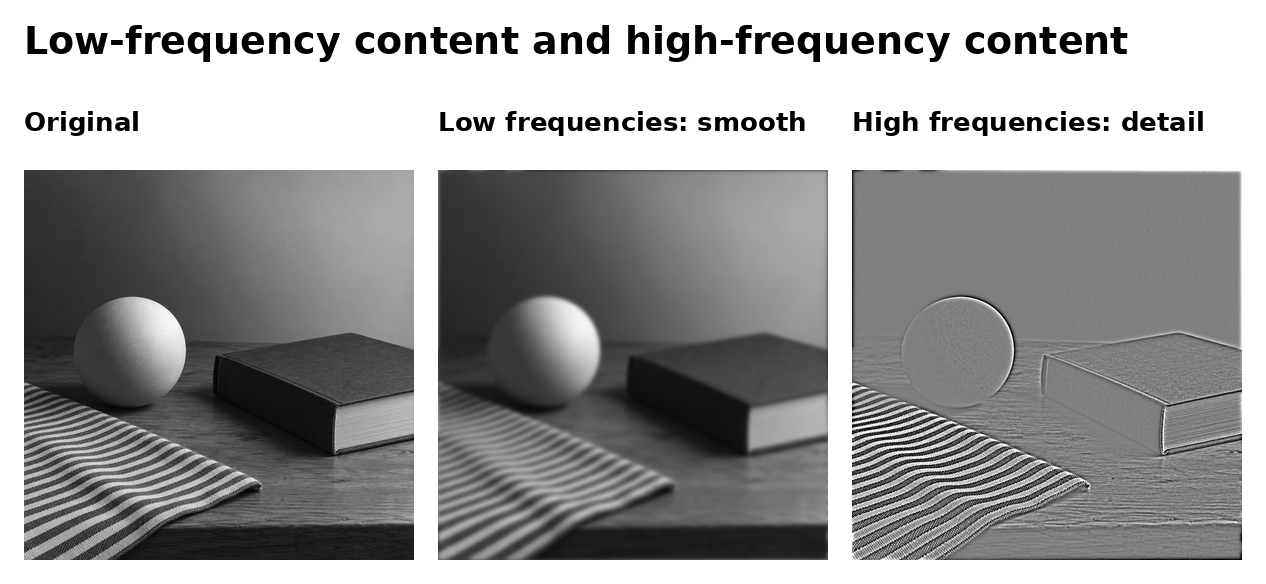
A frequency-domain filter multiplies each coefficient by a transfer function:
Then the inverse FFT produces the output image:
Keeping frequencies near the centre preserves gradual structure and produces a smoother image. Keeping frequencies farther from the centre preserves rapid changes and produces an edge-like detail image.
The high-frequency panel above is rescaled around mid-gray for display. Actual high-pass values contain positive and negative changes around zero.
Small Numerical Example
Consider a grayscale image:
Its 2-D FFT is:
The shape remains :
- is the sum of the four pixel values
- is the average intensity
- The other coefficients describe changes across the rows and columns
Even when the values happen to be real in this small example, FFT coefficients are generally complex.
Minimal NumPy Data Flow
import numpy as np

# image has shape (M, N)
F = np.fft.fft2(image)

# Move low frequencies to the centre for inspection
F_centered = np.fft.fftshift(F)

log_magnitude = np.log1p(np.abs(F_centered))
phase = np.angle(F_centered)

# Undo the display shift before the inverse transform
reconstructed = np.fft.ifft2(
    np.fft.ifftshift(F_centered)
).real
The main shapes are:
| Variable | Shape | Meaning |
|---|---|---|
image | (M, N) | Spatial-domain intensities |
F | (M, N) | Complex FFT coefficients |
F_centered | (M, N) | Same coefficients in centred order |
log_magnitude | (M, N) | Displayable coefficient strengths |
phase | (M, N) | Coefficient angles in radians |
reconstructed | (M, N) | Recovered spatial image |
Common Confusions
Reading the spectrum
A bright point in the magnitude spectrum means that one frequency pattern has a large coefficient. It does not identify a bright pixel at the same location in the original image.
fft2()changes the representation, not the array dimensionsfftshift()changes the coefficient arrangement, not the frequency content- Distance from the spectrum centre describes spatial frequency, not distance between objects in the original image
- The magnitude display shows strength, while phase supplies spatial alignment
- A natural image produces many coefficients because many basis patterns are required to reconstruct its shapes, edges, textures, and lighting